Interesting experiments of all kinds (inside and outside the bounds of rigorous academic work) executed over the years are journaled here.
2019 : Accurate refractive index measurement using a Michelson interferometer
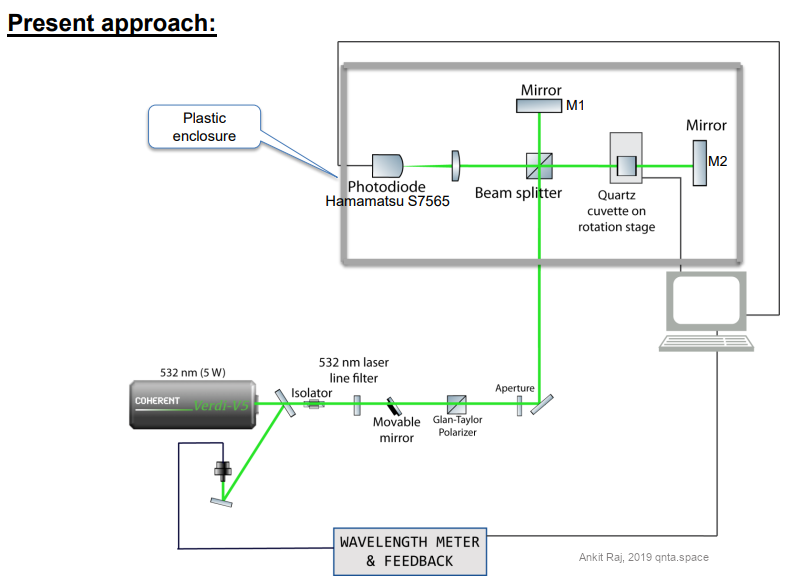
For the project on Raman cross-sections, I needed the values of refractive indices of a few liquids. Further, I was inetrested in measuring it with high accuracy for the specific laser for my Raman measurements and temperature in the laboraotry. After considering a few design options, I went to construct a Michelson-interferometer based refractive index measurement device based on counting interference fringes. The path length change is caused by the rotation of the sample cell containing the liquid.
The sample was placed on one of the arms of the interferometer and rotated using a motorized stage. Path length change caused a variation in the fringes which were counted as a function of angle. The instrument is based on a Hamamatsu S7565 photodiode (as detector), and a SigmaKoki motorized rotation stage on which the liquid containing the cuvette is mounted and rotated by 0.005 degree per step. The setup was controlled using the custom-developed LabVIEW software. It required about 0.3 mL of the liquid in the sample cuvette. A laser power of approximately 5 mW was required at the entrance of the interferometer. Results: The refractive indices of air, water, and benzene were determined with high accuracy, with an error of ±0.002 at 532.2 nm. Error Sources were the uncertainity in laser wavelength, path length jitter, and most importantly, rotation angle inaccuracies.
The design is based on work of Abbas and Khalil [Acta Physica Polonica A, 1, 129 (2016)] Link: <https://doi.org/10.12693/APhysPolA.129.59>. Optical design is shown below.
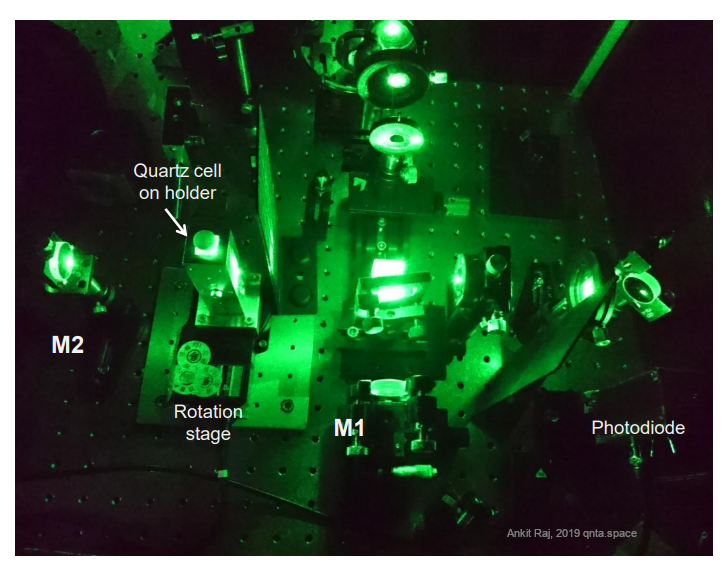
Photograph of the constructed setup is placed below.
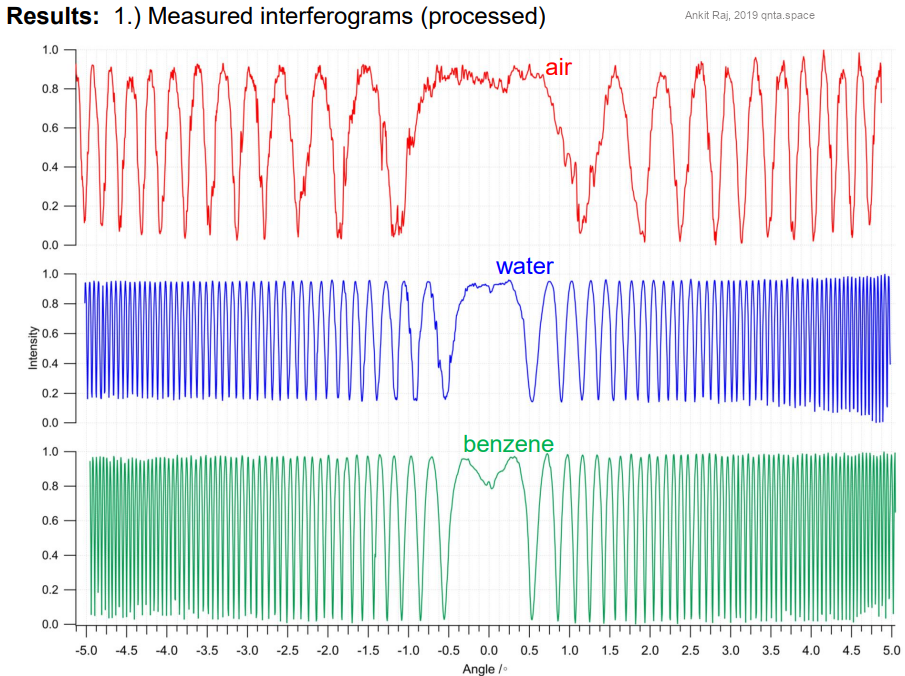
Results acquired on this setup, namely, the interferograms for air, water and benzene are shown.
The sample cell (a standard 10 mm path length cuvette) was rotated on a motorized stage controlled via PC. Interference data (photon counts measured via photosiode) were digitized through ADC and saved after averaging in 0.75 s, at each angle value. The refractive index of benzene and water were determined as 1.333 and 1.485 at 532.2 nm laser with error of about 0.002, at temperature of 298.15 K. Data analysis was performed in IgorPro using custom developed scripts. The developed interferometer discussed above was good enough to obtain reliable refractive index data for a few target liquids.
More accurate instruments have been developed and reported on this topic, for example, Link: <https://doi.org/10.1016/j.optlastec.2012.04.020> by Kachiraju and Gregory, “Determining the refractive index of liquids using a modified Michelson interferometer”, Optics & Laser Technology, (2012).
2019-20: Data-logger for measuring ambient parameters around a Raman spectrometer
Custom developed Raman spectrometers are exposed with light propagating through open space (sometimes over long distances). For the present case, the target was to study the stability of obtained Raman spectra on a custom developed Raman spectrometer. In order to assess the extent of change of ambient conditions, a miniature data-logger based on Arduino was developed with software interface to LabVIEW on a Windows PC. This data logger measured temperature at three different points on the optical table, along with atmospheric humidity and pressure (inside the data logger), and sent this data over the serial interface (RS-232) to be read by a LabVIEW VI.
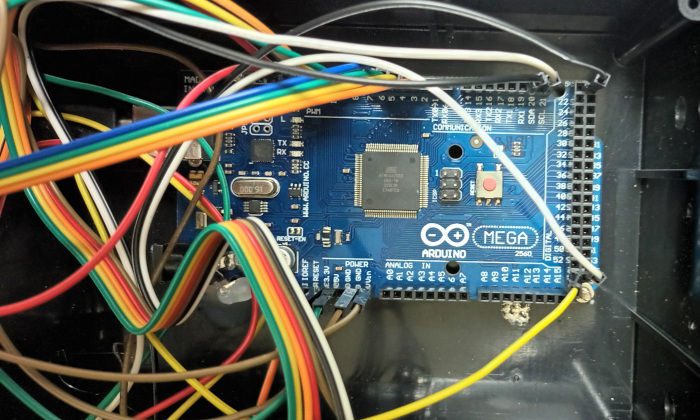
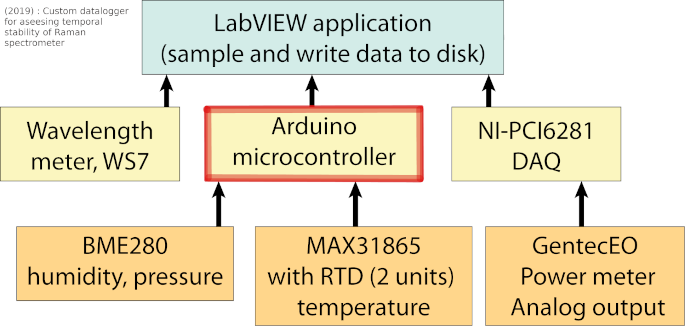
The main LabVIEW VI which read data from the data-logger also sampled temperature and wavelength information from a wavelength meter, as well as the laser power from a power meter after ADC conversion. See figure below showing the Arduino at the heart of the unit.
The data flow is shown below.
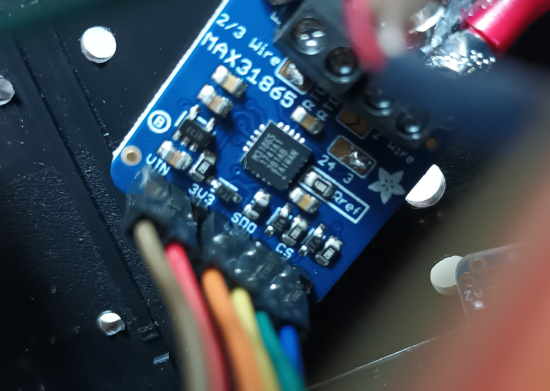
Temperature measurement at the polychromator slit and near laser head - connected to Arduino
PT100 3-wire RTD with MAX31865 amplifier from Adafruit, with SPI communication (accuracy \(\pm\) 0.15K, precision \(\pm\) 0.2K). Accuracy was checked in the lab using ice and boiling water.
Ambient humidity and pressure measurement - connected to Arduino
BME280 (sensor from Bosch) mounted on IC unit by Adafruit, with SPI communication was
used with Arduino. This sensor has accuracy of \(\pm\) 3% for relative humidity and \(\pm\) 1hPa for
pressure.
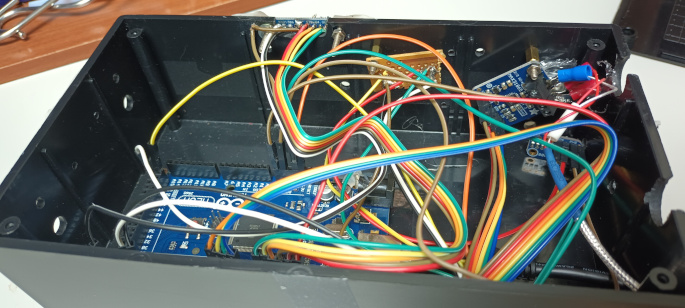
Arduino AT-Mega2560 microcontroller
This microcontroller was housed in a lab made box and connected to a miniature display.
Communication with other sensors was made with protocols mentioned for each sensor. After
averaging 10 measurements, this device wrote the results on the Serial out which was read
by the LabVIEW VI.
Laser wavenumber measurement - connected to PC
Wavelength meter (HighFinesse, WS7) was interfaced with LabVIEW program allowing sampling of the laser wavenumber, feedback voltage to laser for stabilization of wavelength and the internal temperature.
Laser power measurement - analog output measured by NI-DAQ
Power was measured via GentecEO power meter (TPM 300 CE) equipped with UP19K-15S-
H5-D0 thermopile sensor. Analog voltage output from the power meter was readout using Data
Acquisition (DAQ) device (PCI-6281, National Instruments) which was interfaced to the main control LabVIEW VI.
The resulting dataset from the main VI was as follows:
Temperature sensor (PT100 3-wire RTD connected to MAX31865) unit is pictured below.
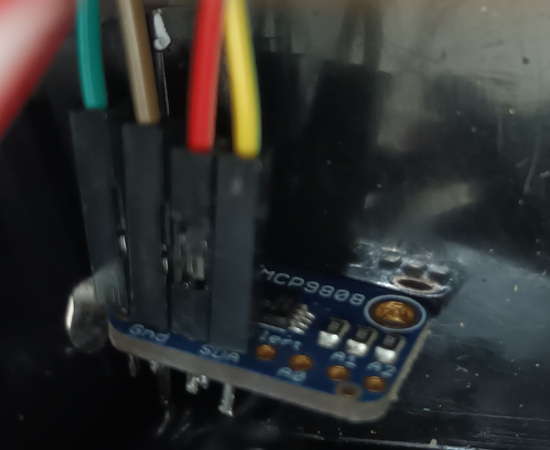
The MCP sensor is pictured below.
Overall housing of the sensor unit.
Eventually the acquired temporal data on ambient conditions were correlated with Raman spectral changes. The results were analyzed looking at variations in Raman band positions of benzene and emission lines of neon. See Link: <https://doi.org/10.1002/jrs.6085> for more details.
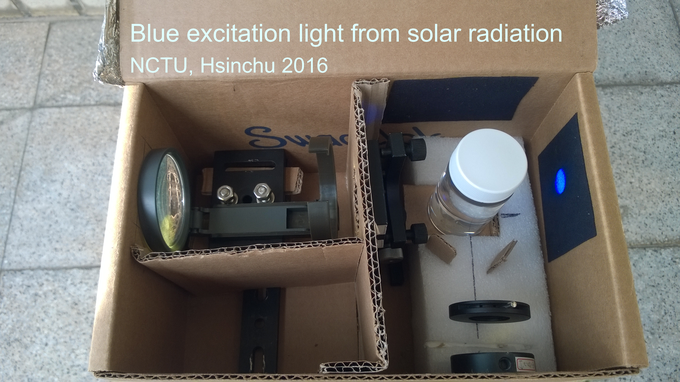
2016: Using sun-light to observe Raman scattering
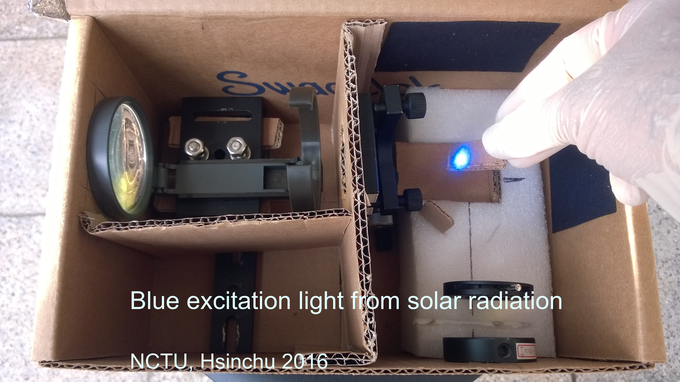
In this set of experiments, we attempted to use the blue portion of the sunlight to generate Raman scattering from liquid sample and observe this scattered light in the green to yellow region.
A set of filters were used for this purpose. Short-pass filter was used for obtaining light in the blue region (from 350 to 400 nm) and a long pass filter was used before the detector to look only at the scattered light at higher wavelengths.
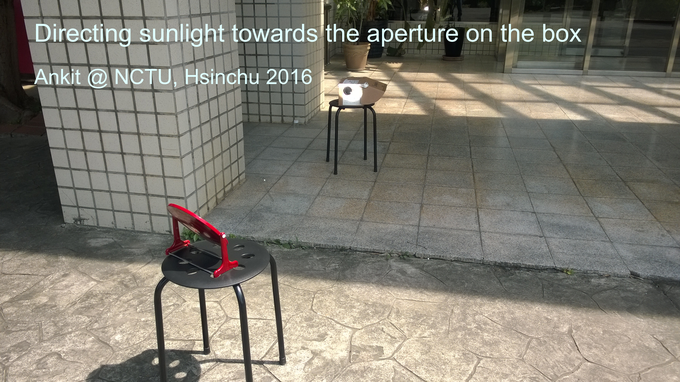
To prevent any ambient light passing to the cellphone’s camera (used as detector), a box housing was used in which the filters, sample and the camera were placed. Sunlight was focused using a magnification lens. The sample chamber was further isolated in a dark area. It was covered in , with only blue light entering from a small aperture, which is perpendicular to the detection-optical-axis. Concentrated solution of napthalene in benzene was used as the sample.
Tight focusing with a plano-convex lens followed by the short-pass filter produced fairly intense blue light (this was in peak of summer in Hsinchu, Taiwan). An ordinary magnification glass was used as the lens.
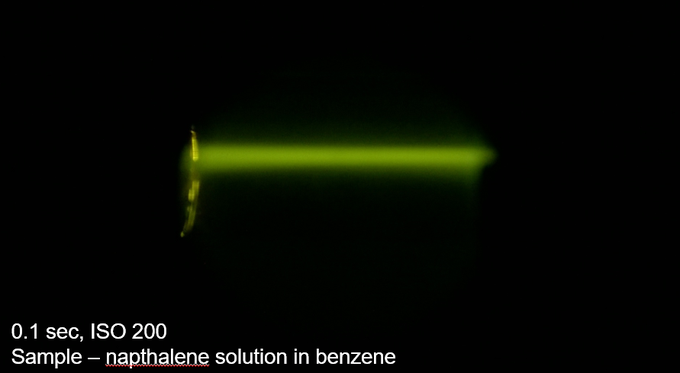
For the detector, a cell phone’s camera was used. Optical image was acquired across a dark background, shown below. The recorded image did not include any Rayleigh scattering (which would be in blue) but comprised of yellowish beam, only faintly observable with human eyes. This would be Raman scattering along with some fluorescence. The image was acquired using a cell phone camera with manually settings. Exposure time of 0.1 s and ISO of 200 was used.
Acknowledgements: Prof. Hiro-o Hamaguchi and Dr. Masahiro Ando